July 31, 2007
Visualising OpenLearn Course Listings
In the previous post (Visualising OpenLearn Course Listings: Prequel) I described some of the motivation behind looking for visual ways to display OpenLearn course listings, and described how I got OpenLearn course listing data into a format that could be uploaded to the Many Eyes visualisation tool.
In this post, I'll quickly demonstrate several possible visualisations, leaving a fuller discussion of the pros, cons, mertis and otherwise of each technique to a series of later posts.
If you want to create your own visualisations, you can find the data here: OpenLearn unit listing data (as of 28/7/07).
OpenLearn Treemap
Treemaps provide a powerful way of visualising hierarchical data. This view shows how we can navigate organise OpenLearn Units by Subject area:
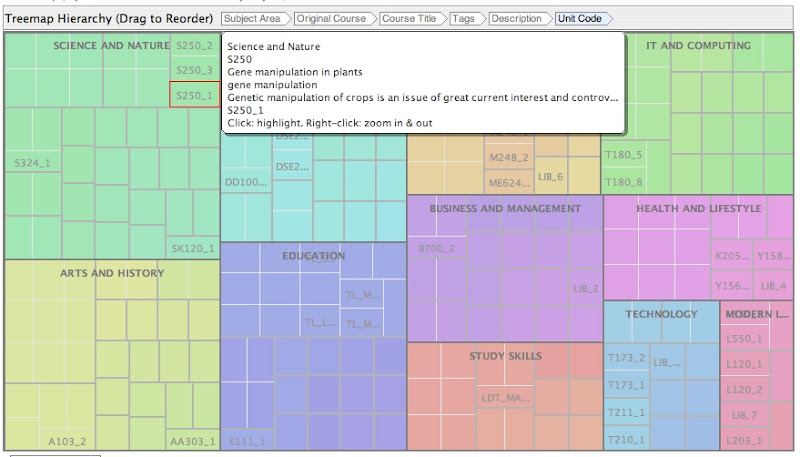
The labels of each of the smallest inner boxes correspond in this case to OpenLearn unit codes.
You might also notice a further level of structure, specifically boxed groupings of courses within a Subject area (groups of cells bounded by a purple(?) or grey(?) line, rather than the white lines separating individual cells). These represent groupings at the level of the originating Open University course (in many cases, several OpenLearn units are derived from a single Open University course).
The following tree map explores the relationship between originating courses and OpenLearn Units in a clearer way:
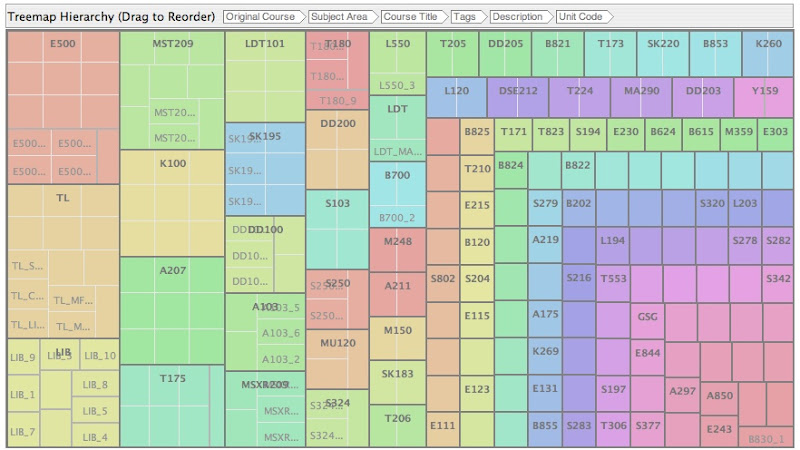
(To generate new views on the Treemap, just reorder the column headings.)
OpenLearn Matrix View
The OpenLearn Units matrix view can be used to illustrate how many units a particular course has contributed to OpenLearn, ordered by subject area. This view is useful for revealing how originating courses may actually contribute to several different subject areas:
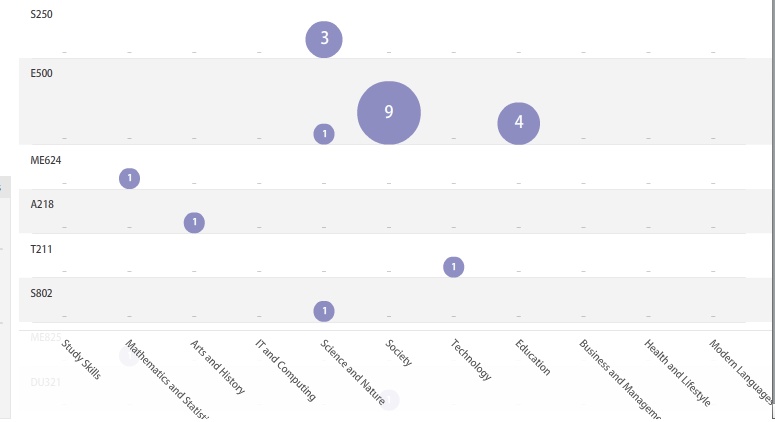
The number in each circle is a count of how many units carry each originating course code label.
OpenLearn Units Network Diagrams
Netowork diagrams can be used to show up relationships between elements of the data set. This view shows the relationship between Subject Areas and content analysis generated tags:
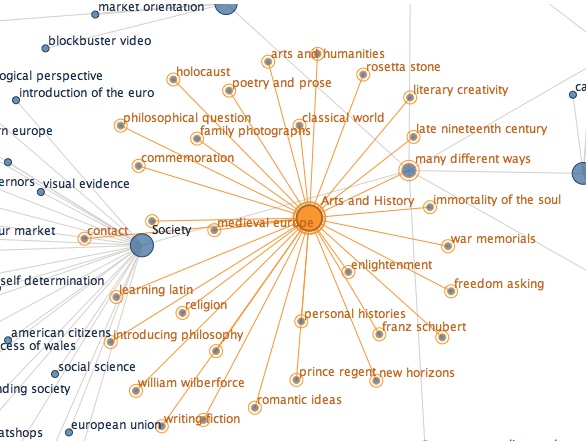
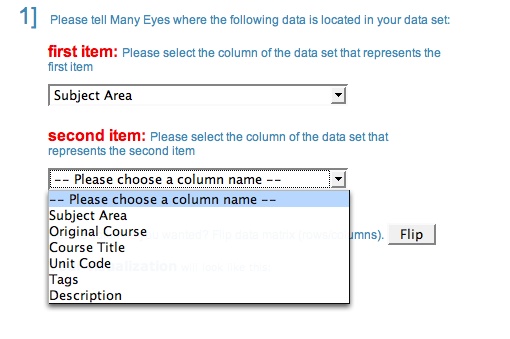
Unlike the Treemap visulisation, in which different views can be obtained form a single visualisation widget, different network maps must created as different visualisations by selecting attribute pairs:
This view shows unit titles arranged around subject areas:

Although network diagrams can get cluttered, they can reveal interesting relationships. If OpenLearn users were allowed to tag units, a visualisation of connections between user tags and courses or user tags and subject areas could prove informative.
OpenLearn Tag Cloud
The Many Eyes Tag Cloud visualisation parses processed input text to procude a tag cloud of the most frequently occuring terms. For example, here is a tag cloud of OpenLearn content analysis tags:

The same visualisation widget can also be used to display clouds for other data fields.
Unfortunately, the tag cloud cannot be used to link to external pages or pop-up large blocks of text (for example, complete unit descriptions would be useful in this case).
I'm not sure that the idea behind Many Eyes was to prototype website navigation tools, but if you consider templated websites - like OpenLearn - as big databases, I think it follows naturally!
Time allowing, I'll pop up a series of separate posts, one per visualisation, looking at each view in a little more detail.
Posted by ajh59 at July 31, 2007 11:23 AMHum, interesting!
I wonder how complicated it would be to do something like that ourselves, or at least provide the right data format automatically to make use of the external system. One for the Technical Director I think!
Also, regarding tagging, you may wish to know that we're implementing user tagging of courses at the moment - release in the autumn some time. For those who have OpenLearn eRoom access, see http://alps/eRoomReq/Files/oci/work/0_d142/L29%20L30%20L31.doc
Posted by: Jenny Gray at July 31, 2007 01:39 PM"I wonder how complicated it would be to do something like that ourselves"
Now there's an idea - let's build our own... ;-)
I had a quick scout around and a couple of possibilities present themselves:
Roomformilk ( http://www.roomformilk.com/ ) is an aggregator with treemap view apparently based around this treemap PHP library: http://neurofuzzy.net/2006/04/28/treemap-php-source-code/
SVG is maybe another way to go? For example, here's a proof-of-concept OPML2SVG treemap XSLT stylesheet: http://protocol7.com/archives/2002/03/17/opml_to_svg/
There are a couple of interesting javascript libraries around already that may be worth looking at too: jsviz ( http://www.kylescholz.com/blog/projects/jsviz/ ) and the (commercial looking) yFiles Web 2.0 Libraries ( http://www.yworks.com/en/products_yfiles_web_about.htm )
If the Many Eyes app supported clickable outlinks, it could be really useful as as navigation generating tool, I think?!
tony
Posted by: Tony Hirst at July 31, 2007 02:03 PM