July 31, 2007
Visualising OpenLearn Course Listings: Prequel
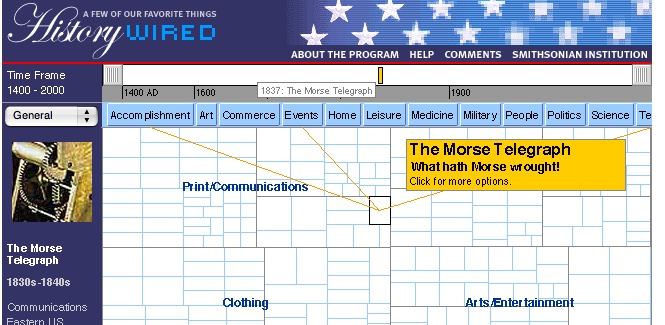
Several weeks ago, I was chatting to Coral Stanion-Nazeri (who's running the OU Clusters "social web tools for practice based learning" project for the Library) about visualising course data. I'd been thinking about visualising OU Courses and Qualifications data (for example, see here and here) but Coral was thinking more in terms of improving the user experience on OpenLearn - courses are listed by topic:

and then by unit - often over several pages. The 'advanced' ordering options are useful, but it can still be a chore to discover a particular course:

Navigation within a course unit is also problematic (for example, see Navigating LabSpace), but that's another story!
Anyway, Coral had been inspired by the treemap browser for a collection of museum objects:
and wondered whether a treemap browser for OpenLearn would aid navigation.
The Many Eyes visualisation tool doesn't (yet?) support links from data to arbitrary URLs, so it can't be used for navigation, but it maybe can help with discovery, or at least demo the visual component for a possible navigation scheme.
So I thought I'd pop some OpenLearn course info into Many Eyes and see what it looked like.
The first issue was how to get the data in. It just so happens that there are some RSS feeds (due for release in mid-August, I think?) on the acceptance testing server that contain lists of courses by topic area, as well as a complete "all OpenLearn Units" feed. The feeds contain the course title, topic area, and course description for each course, as well as other metadata.
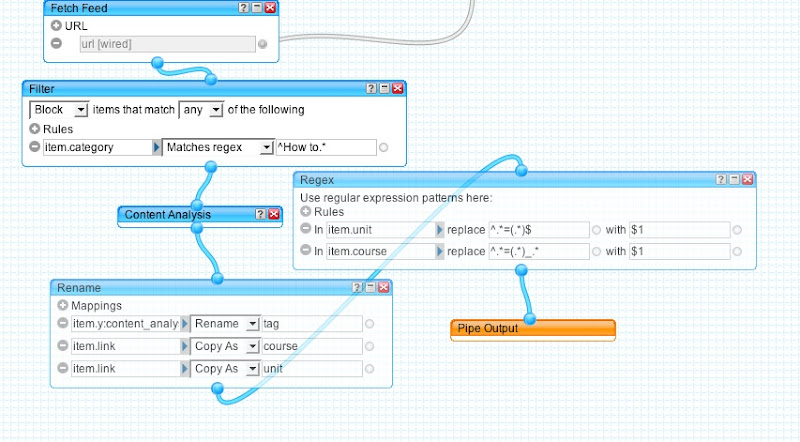
To generate a tabular listing of courses (i.e. to get the data into a format that I could copy and paste into Many Eyes) I ran the feed through a Yahoo pipe and took a JSON feed out, formatting the HTML display using a slightly modified version of the Yahoo pipes Working with Pipes on Your Website.
I also used the pipe to add a couple of extra tags to the feed - the OpenLearn Unit code, and and the original course code, both extracted from the unit URL. I also used the Yahoo content analysis tool to generate a some "tags" for each unit, based on a content analysis of the unit description:
Here's the processed result:

The tabular layout means that when I select all this data and cut and paste it into Many Eyes, the columns are separated by tabs, just how Many Eyes likes it.
In the next post, I'll give a quick overview of how Many Eyes can be used to visualise the Openlearn course information...
Posted by ajh59 at July 31, 2007 09:53 AM