WRC Rally - Portugal, 2017
Driver Analysis - H. PADDON (4)
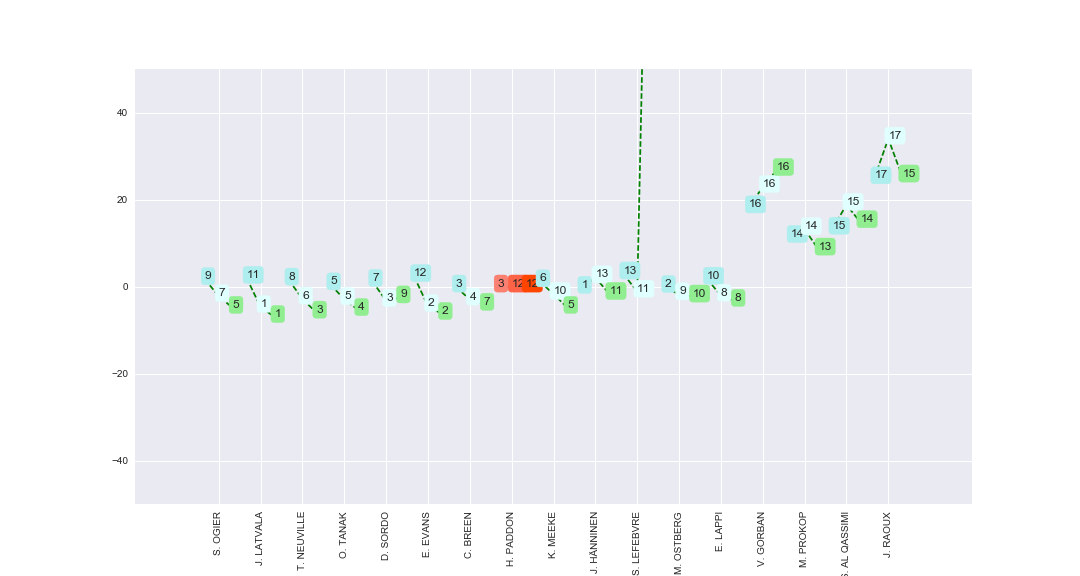
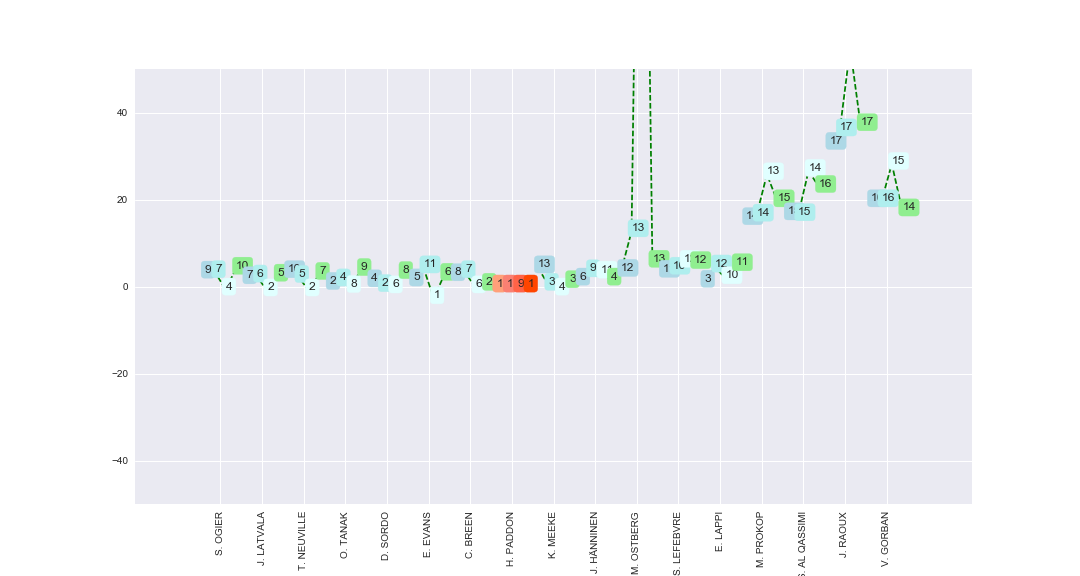
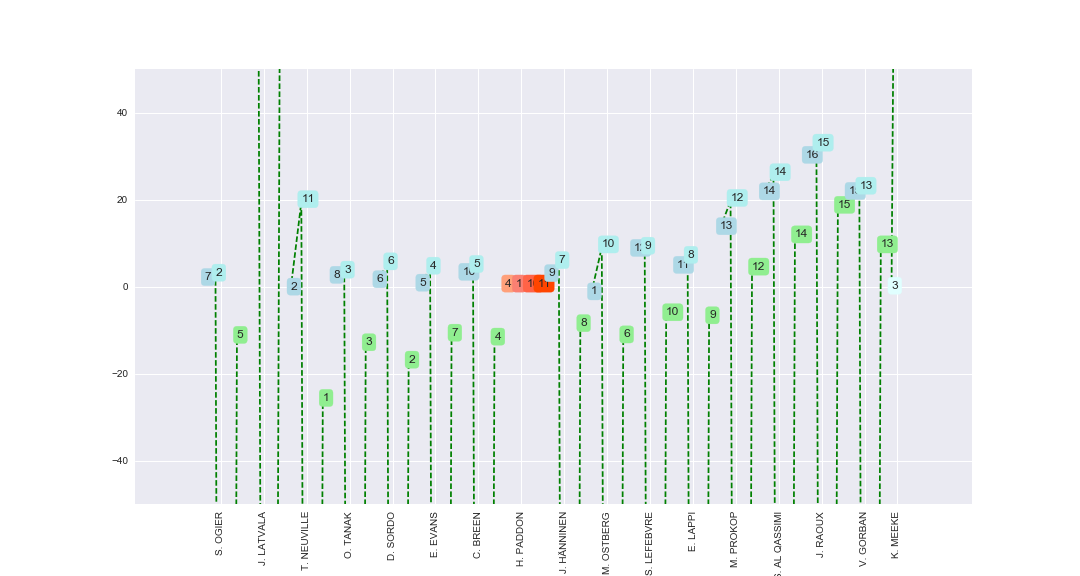
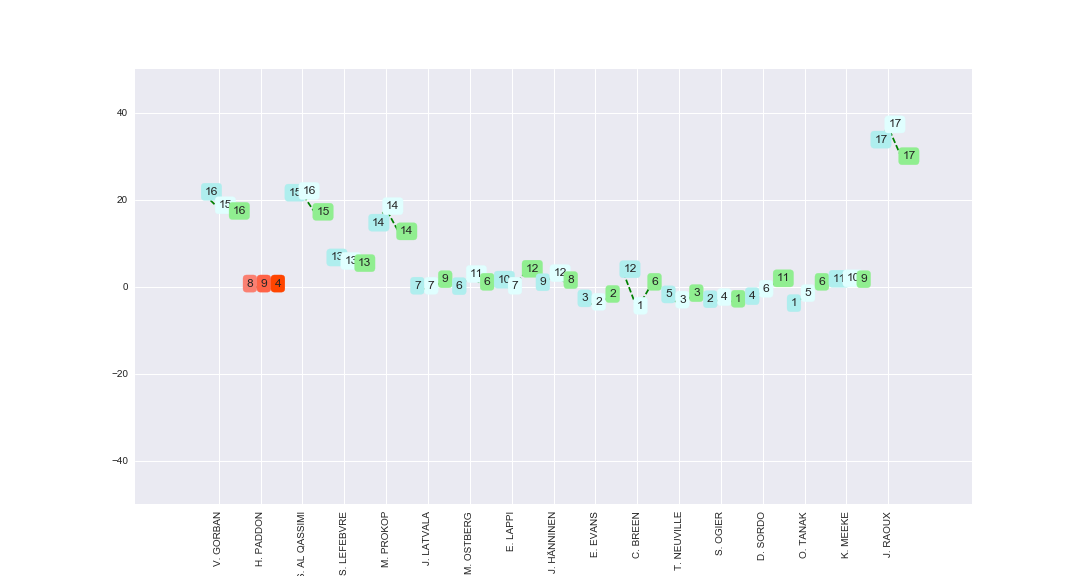
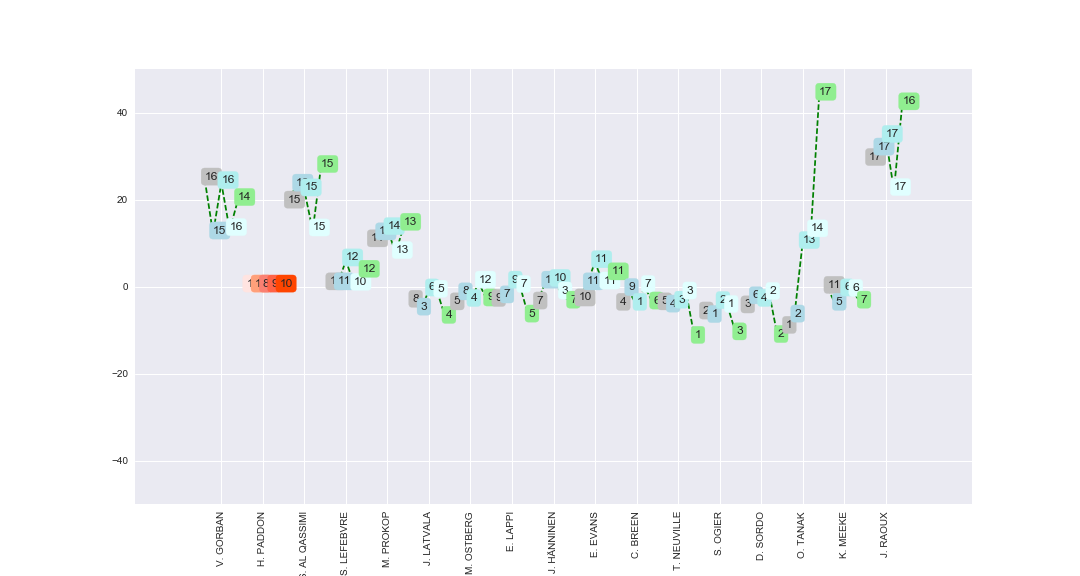
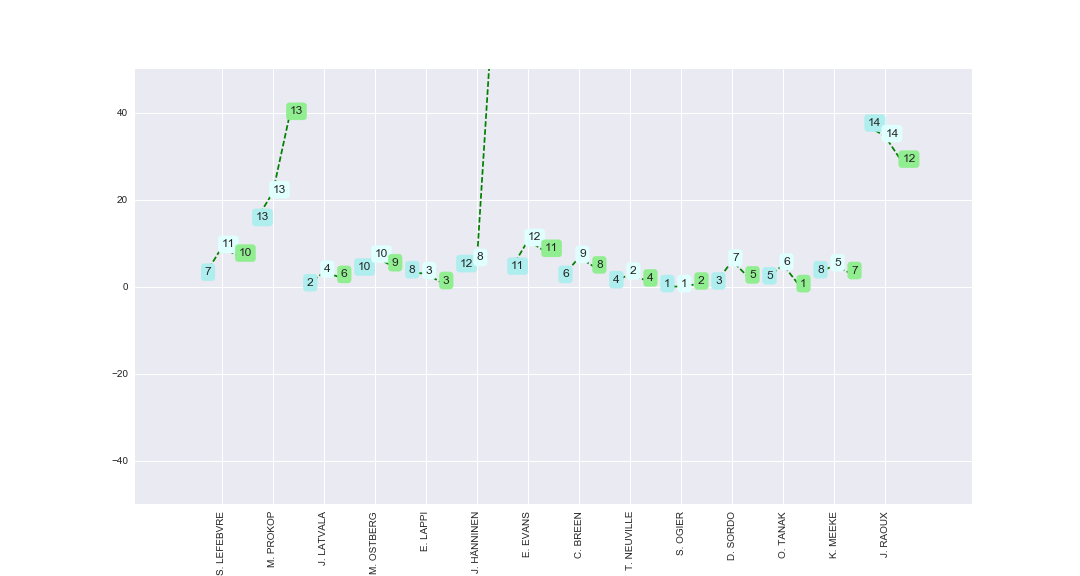
SS1 - stage sector delta time (seconds) compared to H. PADDON stage sector time
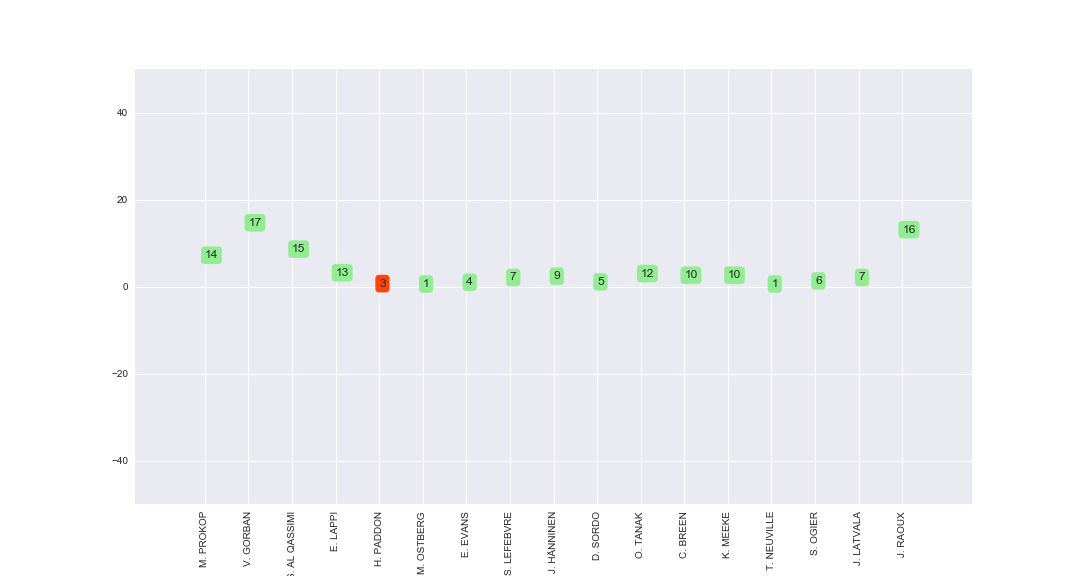
This chart allows you to compare the on stage performance of each driver. It displays the "sector time" of each driver (the time between each split point along the stage), rebased relative to car 4.
SS1 - stage sector time (seconds)
| carNo | driverName | time_stageTime | |
|---|---|---|---|
| start | |||
| 12 | 14 | M. OSTBERG | 00:02:36.600000 |
| 20 | 5 | T. NEUVILLE | 00:02:36.600000 |
| 11 | 4 | H. PADDON | 00:02:36.700000 |
| 13 | 3 | E. EVANS | 00:02:37 |
| 16 | 6 | D. SORDO | 00:02:37.100000 |
| 21 | 1 | S. OGIER | 00:02:37.300000 |
| 14 | 9 | S. LEFEBVRE | 00:02:38.100000 |
| 22 | 10 | J. LATVALA | 00:02:38.100000 |
| 15 | 11 | J. HÄNNINEN | 00:02:38.400000 |
| 18 | 8 | C. BREEN | 00:02:38.600000 |
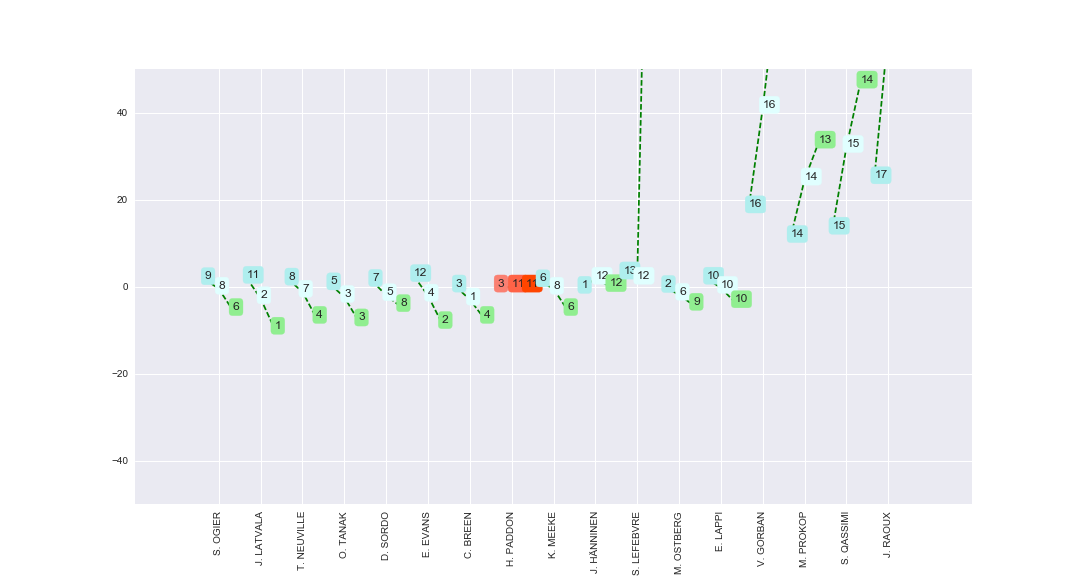
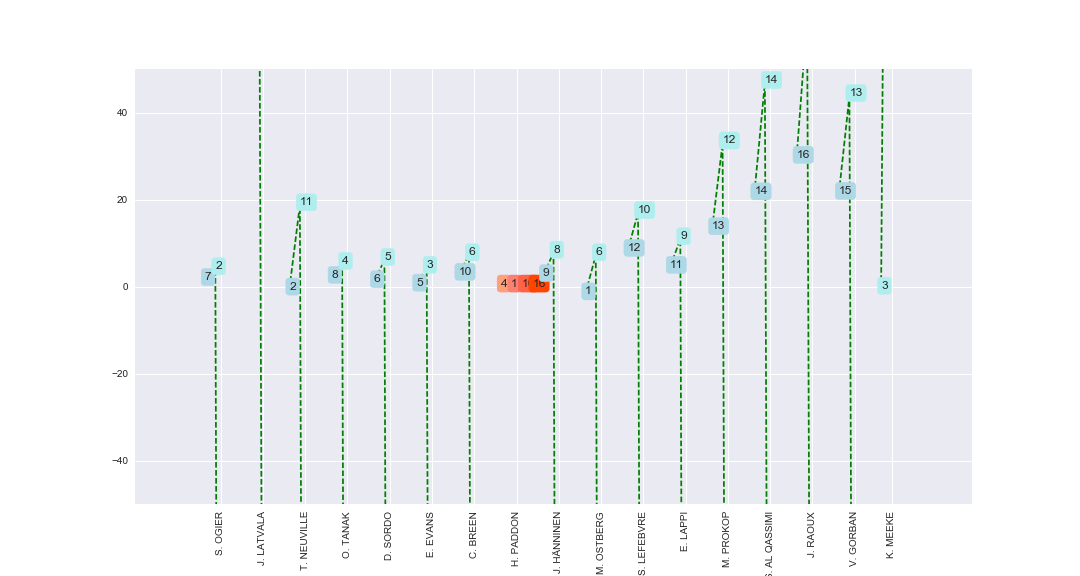
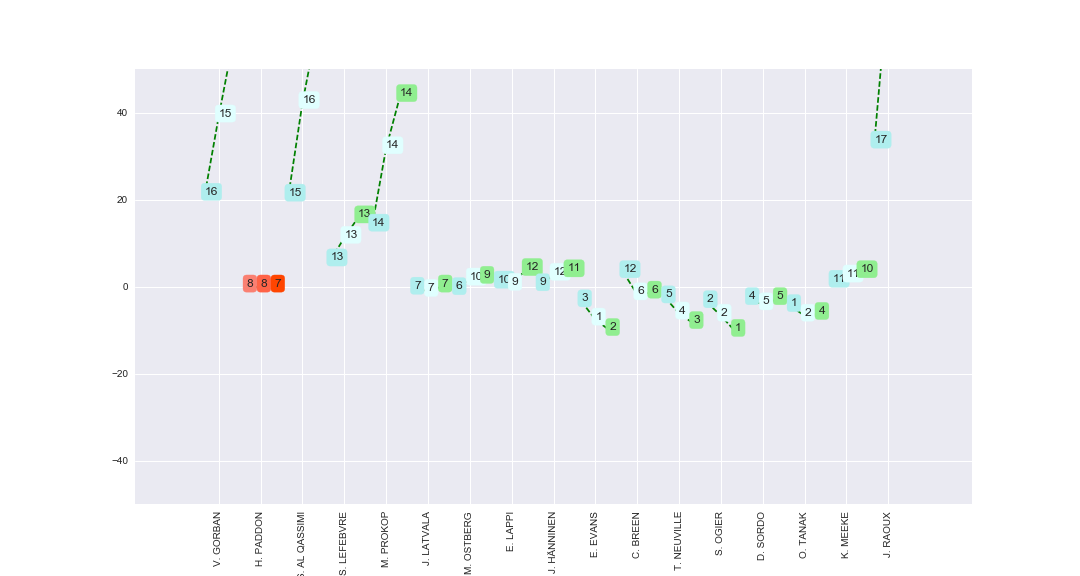
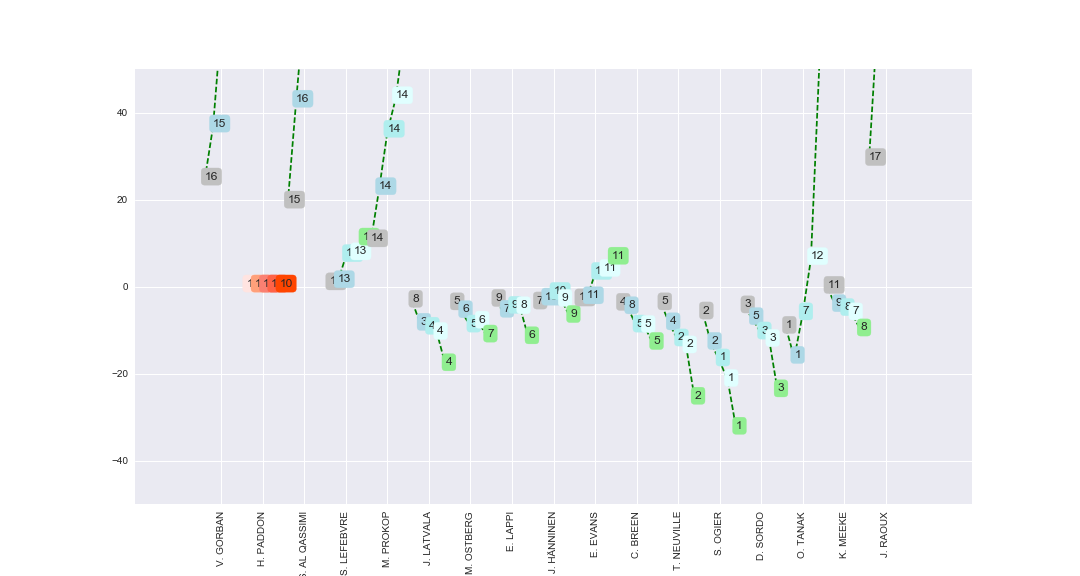
SS1 - stage split delta time (seconds) compared to H. PADDON
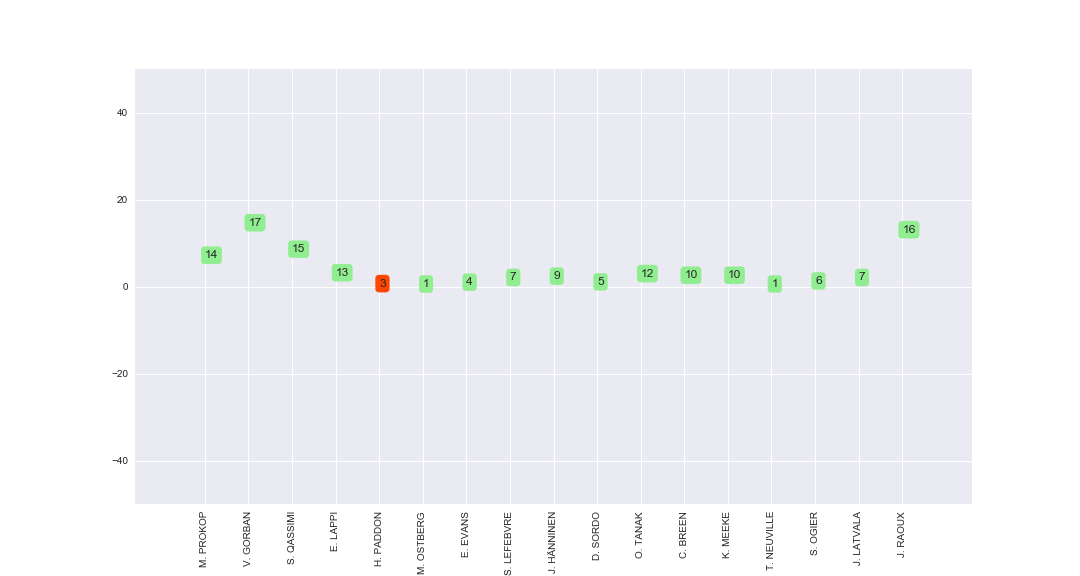
This chart allows you to compare the on stage performance of each driver, with split times rebased relative to car 4 on stage.
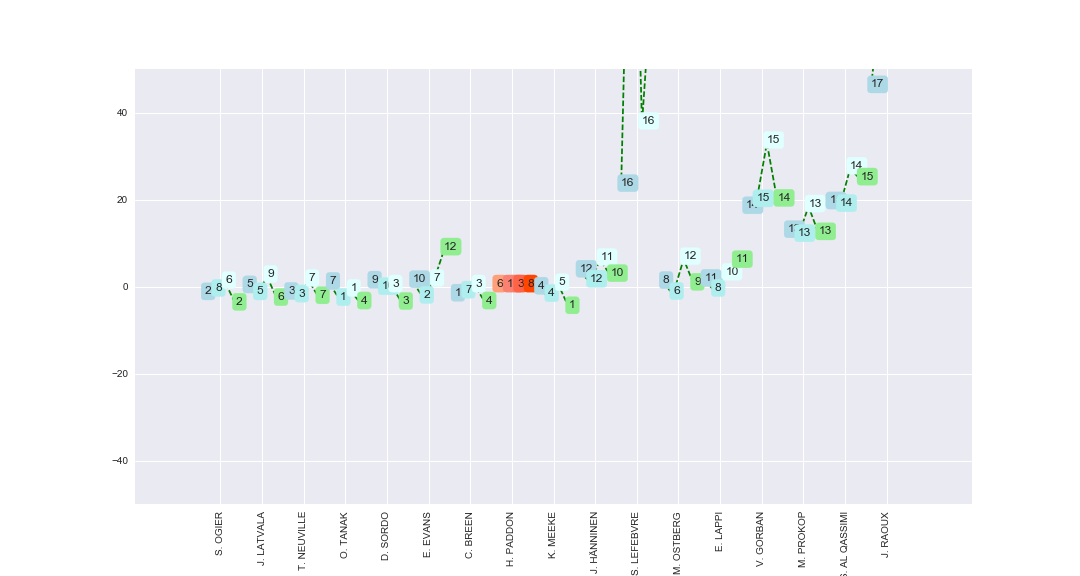
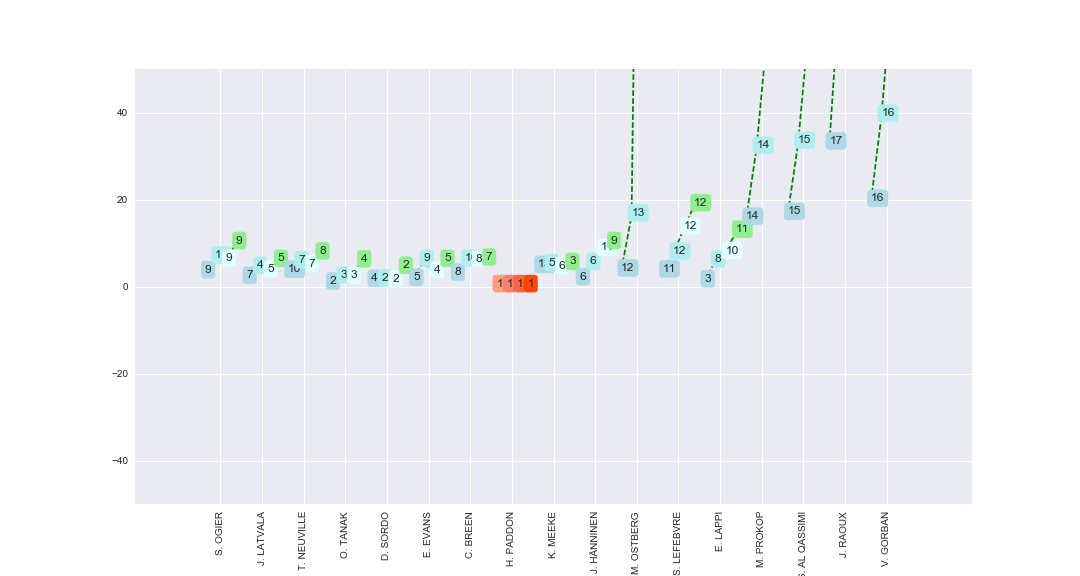
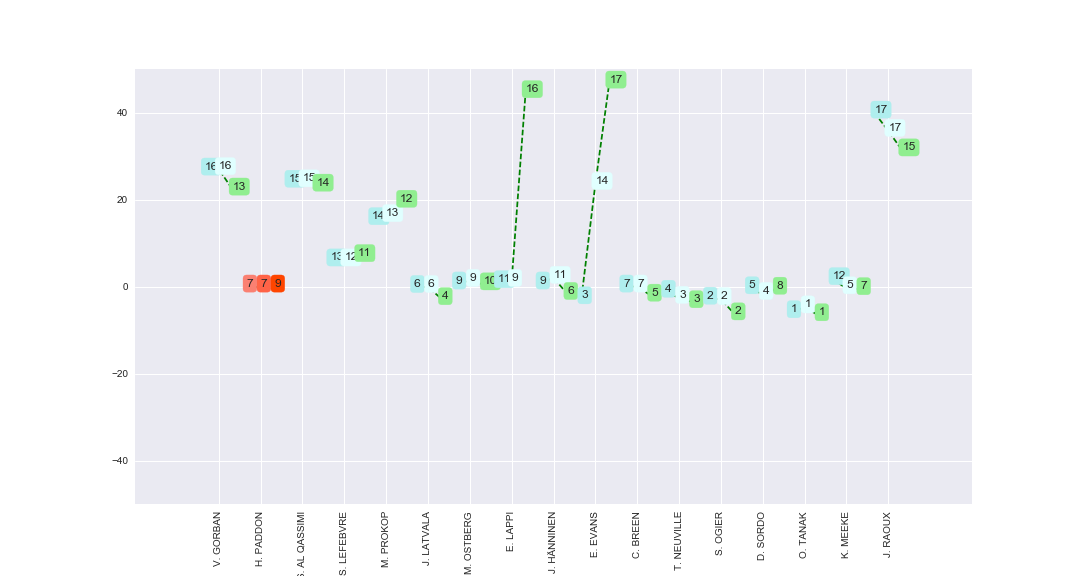
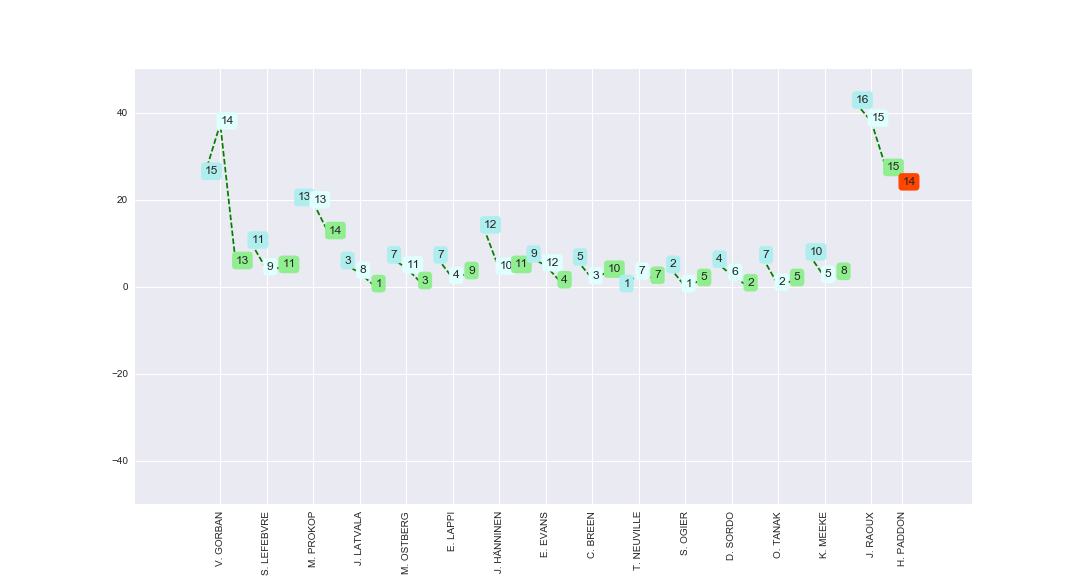
SS2 - stage sector delta time (seconds) compared to H. PADDON stage sector time
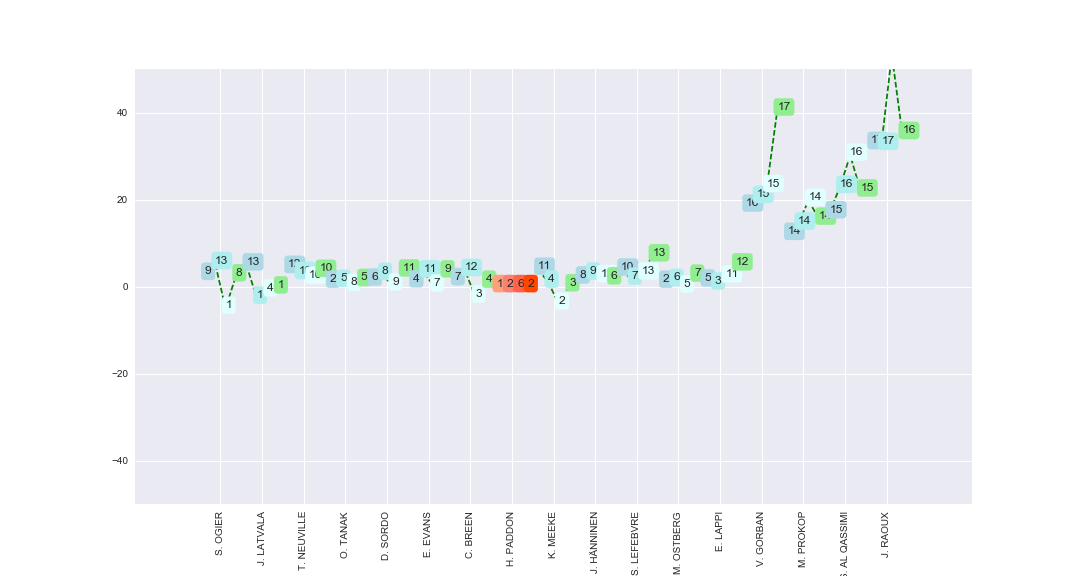
This chart allows you to compare the on stage performance of each driver. It displays the "sector time" of each driver (the time between each split point along the stage), rebased relative to car 4.
SS2 - stage sector time (seconds)
| carNo | driverName | sector_1 | sector_2 | sector_3 | sector_4 | time_stageTime | |
|---|---|---|---|---|---|---|---|
| start | |||||||
| 8 | 4 | H. PADDON | 00:03:39.600000 | 00:03:12.600000 | 00:05:19.400000 | 00:03:32.700000 | 00:15:44.300000 |
| 2 | 10 | J. LATVALA | 00:03:44.600000 | 00:03:09.900000 | 00:05:18.400000 | 00:03:32.400000 | 00:15:45.300000 |
| 9 | 7 | K. MEEKE | 00:03:43.600000 | 00:03:13.600000 | 00:05:15.400000 | 00:03:32.900000 | 00:15:45.500000 |
| 7 | 8 | C. BREEN | 00:03:41.200000 | 00:03:16.300000 | 00:05:17 | 00:03:33.700000 | 00:15:48.200000 |
| 4 | 2 | O. TANAK | 00:03:40.600000 | 00:03:13.800000 | 00:05:19.700000 | 00:03:34.100000 | 00:15:48.200000 |
| 12 | 14 | M. OSTBERG | 00:03:40.600000 | 00:03:14 | 00:05:19.300000 | 00:03:35.100000 | 00:15:49 |
| 1 | 1 | S. OGIER | 00:03:42.400000 | 00:03:17.900000 | 00:05:14.400000 | 00:03:35.200000 | 00:15:49.900000 |
| 6 | 3 | E. EVANS | 00:03:40.700000 | 00:03:16 | 00:05:19.500000 | 00:03:36.100000 | 00:15:52.300000 |
| 5 | 6 | D. SORDO | 00:03:41.100000 | 00:03:15.400000 | 00:05:19.800000 | 00:03:36.300000 | 00:15:52.600000 |
| 10 | 11 | J. HÄNNINEN | 00:03:41.600000 | 00:03:15.500000 | 00:05:21.700000 | 00:03:34.500000 | 00:15:53.300000 |
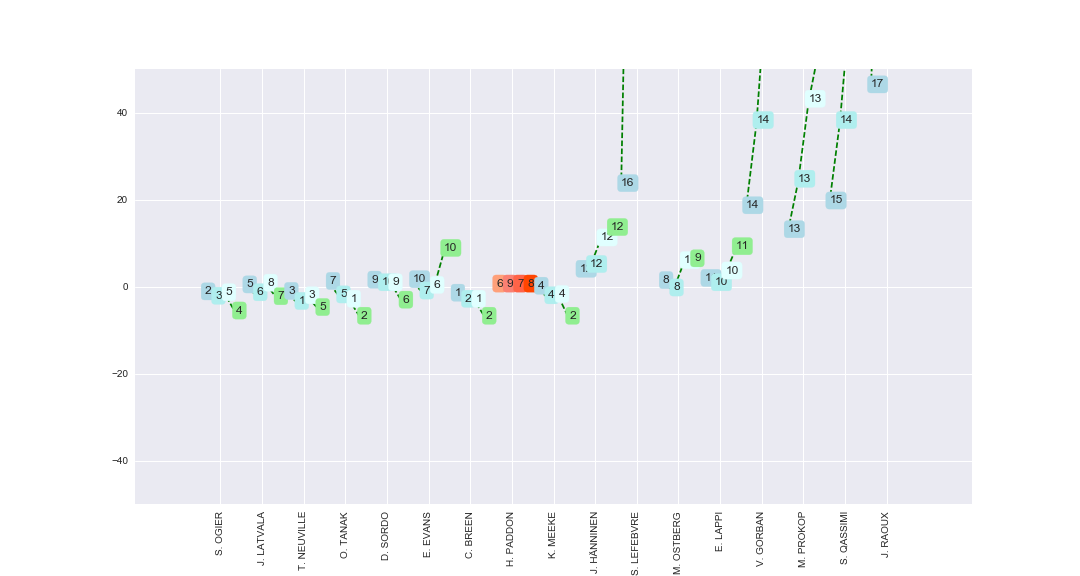
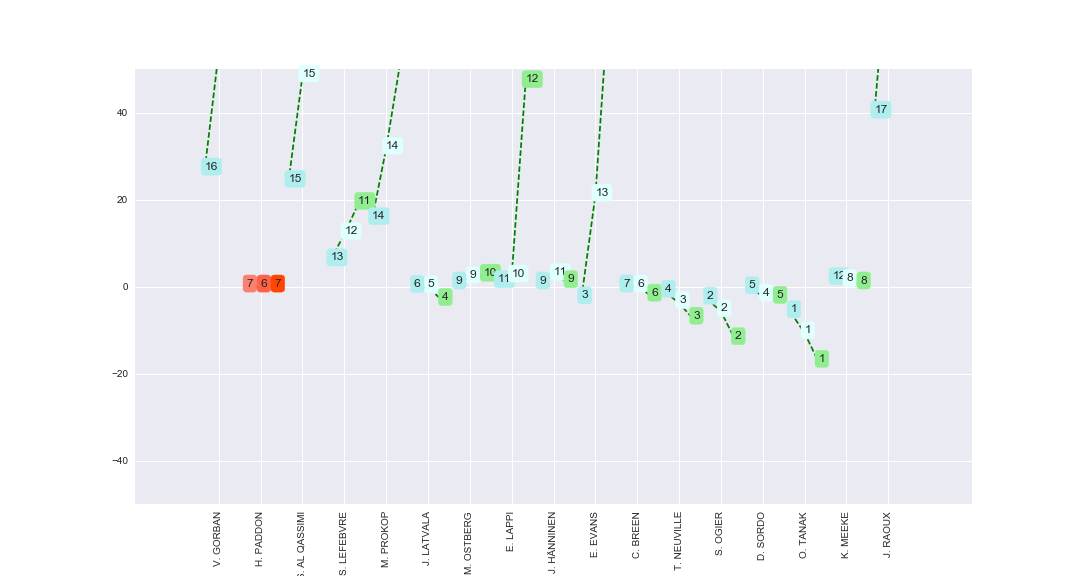
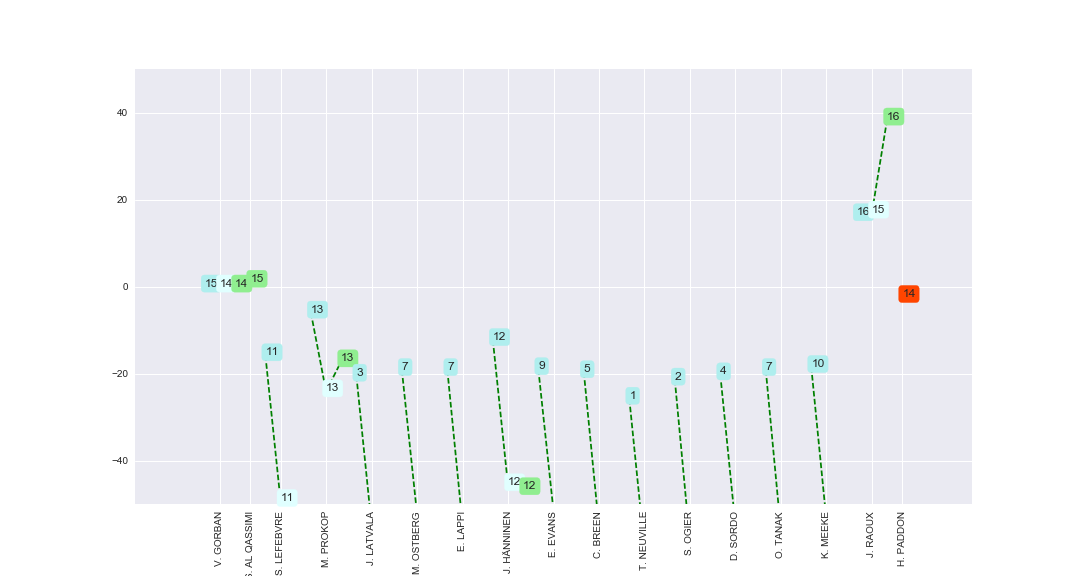
SS2 - stage split delta time (seconds) compared to H. PADDON
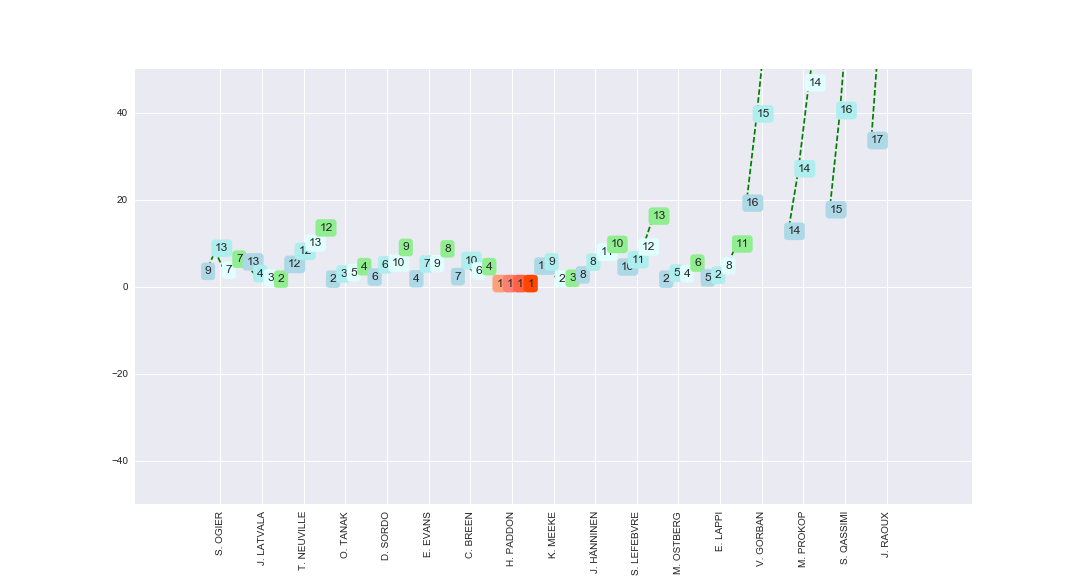
This chart allows you to compare the on stage performance of each driver, with split times rebased relative to car 4 on stage.
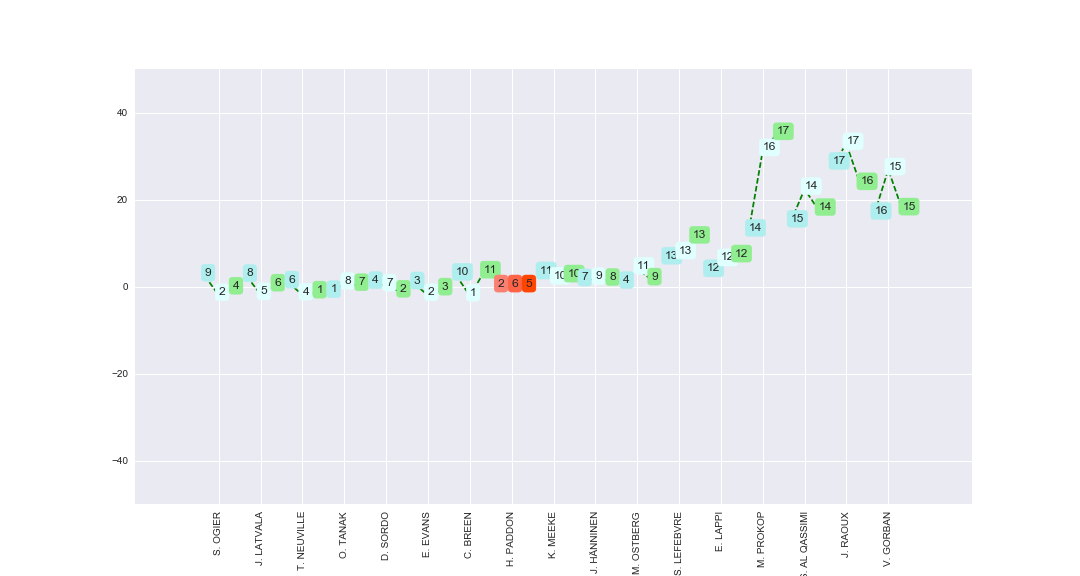
SS3 - stage sector delta time (seconds) compared to H. PADDON stage sector time
This chart allows you to compare the on stage performance of each driver. It displays the "sector time" of each driver (the time between each split point along the stage), rebased relative to car 4.
SS3 - stage sector time (seconds)
| carNo | driverName | sector_1 | sector_2 | sector_3 | time_stageTime | |
|---|---|---|---|---|---|---|
| start | ||||||
| 2 | 10 | J. LATVALA | 00:03:00.500000 | 00:04:29.600000 | 00:02:55.100000 | 00:10:25.200000 |
| 6 | 3 | E. EVANS | 00:03:00.900000 | 00:04:29.800000 | 00:02:55.800000 | 00:10:26.500000 |
| 4 | 2 | O. TANAK | 00:02:59 | 00:04:31.400000 | 00:02:56.700000 | 00:10:27.100000 |
| 3 | 5 | T. NEUVILLE | 00:03:00.100000 | 00:04:31.500000 | 00:02:56.100000 | 00:10:27.700000 |
| 7 | 8 | C. BREEN | 00:02:58.500000 | 00:04:31.300000 | 00:02:57.900000 | 00:10:27.700000 |
| 1 | 1 | S. OGIER | 00:03:00.200000 | 00:04:32.100000 | 00:02:57.200000 | 00:10:29.500000 |
| 9 | 7 | K. MEEKE | 00:02:59.700000 | 00:04:32.600000 | 00:02:57.200000 | 00:10:29.500000 |
| 5 | 6 | D. SORDO | 00:02:59.800000 | 00:04:31 | 00:02:59.600000 | 00:10:30.400000 |
| 12 | 14 | M. OSTBERG | 00:02:58.400000 | 00:04:32.500000 | 00:02:59.800000 | 00:10:30.700000 |
| 13 | 12 | E. LAPPI | 00:03:00.300000 | 00:04:32.200000 | 00:02:58.800000 | 00:10:31.300000 |
SS3 - stage split delta time (seconds) compared to H. PADDON
This chart allows you to compare the on stage performance of each driver, with split times rebased relative to car 4 on stage.
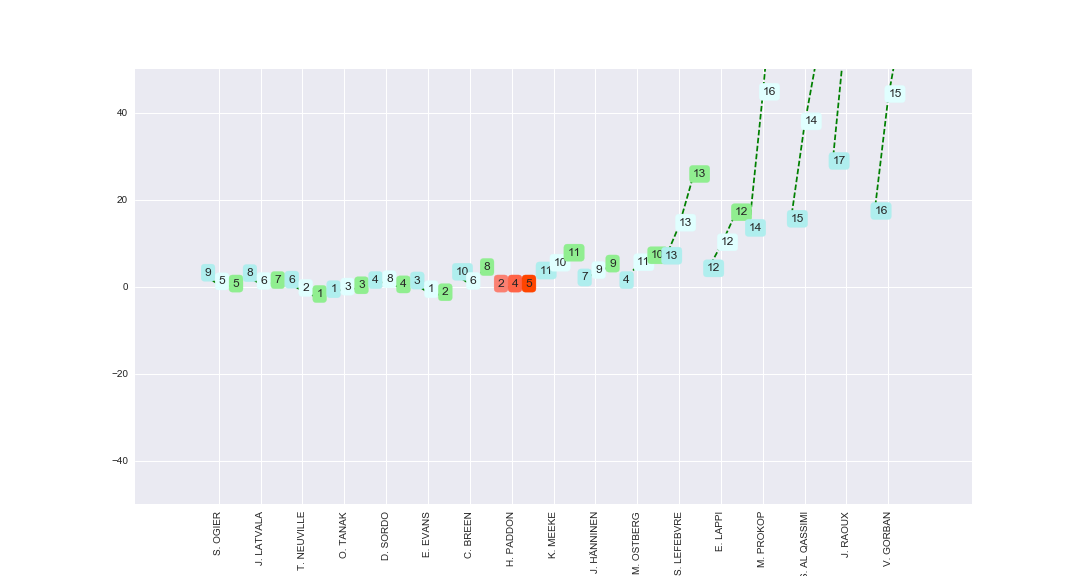
SS4 - stage sector delta time (seconds) compared to H. PADDON stage sector time
This chart allows you to compare the on stage performance of each driver. It displays the "sector time" of each driver (the time between each split point along the stage), rebased relative to car 4.
SS4 - stage sector time (seconds)
| carNo | driverName | sector_1 | sector_2 | sector_3 | sector_4 | time_stageTime | |
|---|---|---|---|---|---|---|---|
| start | |||||||
| 9 | 7 | K. MEEKE | 00:04:21.600000 | 00:04:52.400000 | 00:04:34.400000 | 00:05:25.600000 | 00:19:14 |
| 4 | 2 | O. TANAK | 00:04:22.700000 | 00:04:51.500000 | 00:04:33.100000 | 00:05:26.700000 | 00:19:14 |
| 7 | 8 | C. BREEN | 00:04:20 | 00:04:53.200000 | 00:04:34.100000 | 00:05:26.700000 | 00:19:14 |
| 1 | 1 | S. OGIER | 00:04:20.300000 | 00:04:53.600000 | 00:04:34.900000 | 00:05:26.400000 | 00:19:15.200000 |
| 3 | 5 | T. NEUVILLE | 00:04:20.400000 | 00:04:52.300000 | 00:04:35.400000 | 00:05:27.900000 | 00:19:16 |
| 5 | 6 | D. SORDO | 00:04:23 | 00:04:54 | 00:04:34.100000 | 00:05:26.600000 | 00:19:17.700000 |
| 2 | 10 | J. LATVALA | 00:04:21.900000 | 00:04:52.800000 | 00:04:36.300000 | 00:05:27.500000 | 00:19:18.500000 |
| 8 | 4 | H. PADDON | 00:04:22.100000 | 00:04:54.600000 | 00:04:34.100000 | 00:05:30.600000 | 00:19:21.400000 |
| 12 | 14 | M. OSTBERG | 00:04:22.900000 | 00:04:52.900000 | 00:04:40.400000 | 00:05:31 | 00:19:27.200000 |
| 6 | 3 | E. EVANS | 00:04:23.100000 | 00:04:52 | 00:04:35.400000 | 00:05:39.100000 | 00:19:29.600000 |
SS4 - stage split delta time (seconds) compared to H. PADDON
This chart allows you to compare the on stage performance of each driver, with split times rebased relative to car 4 on stage.
SS5 - stage sector delta time (seconds) compared to H. PADDON stage sector time
This chart allows you to compare the on stage performance of each driver. It displays the "sector time" of each driver (the time between each split point along the stage), rebased relative to car 4.
SS5 - stage sector time (seconds)
| carNo | driverName | sector_1 | sector_2 | sector_3 | sector_4 | time_stageTime | |
|---|---|---|---|---|---|---|---|
| start | |||||||
| 8 | 4 | H. PADDON | 00:03:37.200000 | 00:03:10.500000 | 00:05:16.700000 | 00:03:31.200000 | 00:15:35.600000 |
| 5 | 6 | D. SORDO | 00:03:38.400000 | 00:03:10.600000 | 00:05:16.500000 | 00:03:34.300000 | 00:15:39.800000 |
| 9 | 7 | K. MEEKE | 00:03:41.600000 | 00:03:10.900000 | 00:05:16 | 00:03:32.200000 | 00:15:40.700000 |
| 4 | 2 | O. TANAK | 00:03:37.800000 | 00:03:11.900000 | 00:05:16.600000 | 00:03:35 | 00:15:41.300000 |
| 2 | 10 | J. LATVALA | 00:03:39.100000 | 00:03:12.800000 | 00:05:15.800000 | 00:03:33.700000 | 00:15:41.400000 |
| 6 | 3 | E. EVANS | 00:03:38.600000 | 00:03:14.900000 | 00:05:14 | 00:03:33.900000 | 00:15:41.400000 |
| 7 | 8 | C. BREEN | 00:03:39.800000 | 00:03:13.800000 | 00:05:16.500000 | 00:03:31.600000 | 00:15:41.700000 |
| 3 | 5 | T. NEUVILLE | 00:03:40.500000 | 00:03:12.700000 | 00:05:15.800000 | 00:03:34.100000 | 00:15:43.100000 |
| 10 | 11 | J. HÄNNINEN | 00:03:38.800000 | 00:03:14 | 00:05:19.900000 | 00:03:32.800000 | 00:15:45.500000 |
| 1 | 1 | S. OGIER | 00:03:40.400000 | 00:03:13.800000 | 00:05:16 | 00:03:35.300000 | 00:15:45.500000 |
SS5 - stage split delta time (seconds) compared to H. PADDON
This chart allows you to compare the on stage performance of each driver, with split times rebased relative to car 4 on stage.
SS6 - stage sector delta time (seconds) compared to H. PADDON stage sector time
This chart allows you to compare the on stage performance of each driver. It displays the "sector time" of each driver (the time between each split point along the stage), rebased relative to car 4.
SS6 - stage sector time (seconds)
| carNo | driverName | sector_1 | sector_2 | sector_3 | time_stageTime | |
|---|---|---|---|---|---|---|
| start | ||||||
| 3 | 5 | T. NEUVILLE | 00:02:58.500000 | 00:04:29.600000 | 00:02:56.900000 | 00:10:25 |
| 6 | 3 | E. EVANS | 00:02:58.300000 | 00:04:29.500000 | 00:02:57.600000 | 00:10:25.400000 |
| 4 | 2 | O. TANAK | 00:02:56.300000 | 00:04:32.100000 | 00:02:58.600000 | 00:10:27 |
| 5 | 6 | D. SORDO | 00:02:58.400000 | 00:04:31.700000 | 00:02:57.100000 | 00:10:27.200000 |
| 1 | 1 | S. OGIER | 00:03:00.100000 | 00:04:29.500000 | 00:02:57.800000 | 00:10:27.400000 |
| 8 | 4 | H. PADDON | 00:02:57.600000 | 00:04:31.500000 | 00:02:58.300000 | 00:10:27.400000 |
| 2 | 10 | J. LATVALA | 00:03:00 | 00:04:29.700000 | 00:02:58.500000 | 00:10:28.200000 |
| 7 | 8 | C. BREEN | 00:03:00.300000 | 00:04:29.400000 | 00:03:01.500000 | 00:10:31.200000 |
| 10 | 11 | J. HÄNNINEN | 00:02:59 | 00:04:33.200000 | 00:02:59.800000 | 00:10:32 |
| 11 | 14 | M. OSTBERG | 00:02:58.400000 | 00:04:35.600000 | 00:02:59.900000 | 00:10:33.900000 |
SS6 - stage split delta time (seconds) compared to H. PADDON
This chart allows you to compare the on stage performance of each driver, with split times rebased relative to car 4 on stage.
SS7 - stage sector delta time (seconds) compared to H. PADDON stage sector time
This chart allows you to compare the on stage performance of each driver. It displays the "sector time" of each driver (the time between each split point along the stage), rebased relative to car 4.
SS7 - stage sector time (seconds)
| carNo | driverName | sector_1 | sector_2 | sector_3 | sector_4 | time_stageTime | |
|---|---|---|---|---|---|---|---|
| start | |||||||
| 5 | 6 | D. SORDO | 00:04:23.200000 | 00:04:53.800000 | 00:04:36.900000 | 00:05:26.300000 | 00:19:20.200000 |
| 1 | 1 | S. OGIER | 00:04:23.700000 | 00:04:51.200000 | 00:04:35.900000 | 00:05:32 | 00:19:22.800000 |
| 4 | 2 | O. TANAK | 00:04:24.200000 | 00:04:51.900000 | 00:04:38.400000 | 00:05:30.300000 | 00:19:24.800000 |
| 6 | 3 | E. EVANS | 00:04:22.400000 | 00:04:52.800000 | 00:04:39.600000 | 00:05:32.500000 | 00:19:27.300000 |
| 3 | 5 | T. NEUVILLE | 00:04:21.500000 | 00:05:08.100000 | 00:04:40.600000 | 00:05:17.500000 | 00:19:27.700000 |
| 11 | 14 | M. OSTBERG | 00:04:20.400000 | 00:04:57.700000 | 00:04:40.400000 | 00:05:32.100000 | 00:19:30.600000 |
| 7 | 8 | C. BREEN | 00:04:24.900000 | 00:04:53.200000 | 00:04:41.100000 | 00:05:31.600000 | 00:19:30.800000 |
| 10 | 11 | J. HÄNNINEN | 00:04:24.600000 | 00:04:54.100000 | 00:04:39.200000 | 00:05:34.700000 | 00:19:32.600000 |
| 13 | 12 | E. LAPPI | 00:04:26.500000 | 00:04:55.300000 | 00:04:42.900000 | 00:05:36.500000 | 00:19:41.200000 |
| 12 | 9 | S. LEFEBVRE | 00:04:30.400000 | 00:04:57.400000 | 00:04:48.900000 | 00:05:37.200000 | 00:19:53.900000 |
SS7 - stage split delta time (seconds) compared to H. PADDON
This chart allows you to compare the on stage performance of each driver, with split times rebased relative to car 4 on stage.
SS8 - stage sector delta time (seconds) compared to H. PADDON stage sector time

This chart allows you to compare the on stage performance of each driver. It displays the "sector time" of each driver (the time between each split point along the stage), rebased relative to car 4.
SS8 - stage sector time (seconds)
| carNo | driverName | time_stageTime | |
|---|---|---|---|
| start | |||
| 1 | 1 | S. OGIER | 00:01:48.800000 |
| 3 | 5 | T. NEUVILLE | 00:01:49 |
| 8 | 4 | H. PADDON | 00:01:49.300000 |
| 4 | 2 | O. TANAK | 00:01:49.800000 |
| 16 | 31 | A. MIKKELSEN | 00:01:50 |
| 6 | 3 | E. EVANS | 00:01:50.200000 |
| 5 | 6 | D. SORDO | 00:01:50.500000 |
| 11 | 9 | S. LEFEBVRE | 00:01:50.700000 |
| 10 | 14 | M. OSTBERG | 00:01:51 |
| 7 | 8 | C. BREEN | 00:01:51.100000 |
SS8 - stage split delta time (seconds) compared to H. PADDON
This chart allows you to compare the on stage performance of each driver, with split times rebased relative to car 4 on stage.
SS9 - stage sector delta time (seconds) compared to H. PADDON stage sector time

This chart allows you to compare the on stage performance of each driver. It displays the "sector time" of each driver (the time between each split point along the stage), rebased relative to car 4.
SS9 - stage sector time (seconds)
| carNo | driverName | time_stageTime | |
|---|---|---|---|
| start | |||
| 10 | 14 | M. OSTBERG | 00:01:46.500000 |
| 1 | 1 | S. OGIER | 00:01:47.100000 |
| 6 | 3 | E. EVANS | 00:01:47.100000 |
| 4 | 2 | O. TANAK | 00:01:47.300000 |
| 3 | 5 | T. NEUVILLE | 00:01:47.400000 |
| 5 | 6 | D. SORDO | 00:01:47.600000 |
| 11 | 9 | S. LEFEBVRE | 00:01:48 |
| 7 | 8 | C. BREEN | 00:01:48.100000 |
| 9 | 11 | J. HÄNNINEN | 00:01:48.100000 |
| 16 | 31 | A. MIKKELSEN | 00:01:48.400000 |
SS9 - stage split delta time (seconds) compared to H. PADDON
This chart allows you to compare the on stage performance of each driver, with split times rebased relative to car 4 on stage.
SS10 - stage sector delta time (seconds) compared to H. PADDON stage sector time
This chart allows you to compare the on stage performance of each driver. It displays the "sector time" of each driver (the time between each split point along the stage), rebased relative to car 4.
SS10 - stage sector time (seconds)
| carNo | driverName | sector_1 | sector_2 | sector_3 | time_stageTime | |
|---|---|---|---|---|---|---|
| start | ||||||
| 13 | 1 | S. OGIER | 00:03:41.200000 | 00:03:47.800000 | 00:03:17.400000 | 00:10:46.400000 |
| 10 | 3 | E. EVANS | 00:03:41.400000 | 00:03:46.700000 | 00:03:18.500000 | 00:10:46.600000 |
| 12 | 5 | T. NEUVILLE | 00:03:42.300000 | 00:03:47.200000 | 00:03:18.700000 | 00:10:48.200000 |
| 15 | 2 | O. TANAK | 00:03:40.300000 | 00:03:48.700000 | 00:03:21.300000 | 00:10:50.300000 |
| 14 | 6 | D. SORDO | 00:03:41.900000 | 00:03:49.700000 | 00:03:22.100000 | 00:10:53.700000 |
| 11 | 8 | C. BREEN | 00:03:48.100000 | 00:03:45.800000 | 00:03:21.300000 | 00:10:55.200000 |
| 2 | 4 | H. PADDON | 00:03:44.800000 | 00:03:50.900000 | 00:03:20.900000 | 00:10:56.600000 |
| 6 | 10 | J. LATVALA | 00:03:44.300000 | 00:03:50.400000 | 00:03:21.900000 | 00:10:56.600000 |
| 7 | 14 | M. OSTBERG | 00:03:44.200000 | 00:03:53.100000 | 00:03:21.300000 | 00:10:58.600000 |
| 16 | 7 | K. MEEKE | 00:03:45.900000 | 00:03:52.100000 | 00:03:21.900000 | 00:10:59.900000 |
SS10 - stage split delta time (seconds) compared to H. PADDON
This chart allows you to compare the on stage performance of each driver, with split times rebased relative to car 4 on stage.
SS11 - stage sector delta time (seconds) compared to H. PADDON stage sector time
This chart allows you to compare the on stage performance of each driver. It displays the "sector time" of each driver (the time between each split point along the stage), rebased relative to car 4.
SS11 - stage sector time (seconds)
| carNo | driverName | sector_1 | sector_2 | sector_3 | time_stageTime | |
|---|---|---|---|---|---|---|
| start | ||||||
| 15 | 2 | O. TANAK | 00:04:52.200000 | 00:04:24.300000 | 00:04:16.100000 | 00:13:32.600000 |
| 13 | 1 | S. OGIER | 00:04:55.300000 | 00:04:26.200000 | 00:04:16.300000 | 00:13:37.800000 |
| 12 | 5 | T. NEUVILLE | 00:04:56.900000 | 00:04:26.500000 | 00:04:19.100000 | 00:13:42.500000 |
| 6 | 10 | J. LATVALA | 00:04:58 | 00:04:29 | 00:04:19.800000 | 00:13:46.800000 |
| 14 | 6 | D. SORDO | 00:04:57.700000 | 00:04:27.400000 | 00:04:22.200000 | 00:13:47.300000 |
| 11 | 8 | C. BREEN | 00:04:58.100000 | 00:04:29.100000 | 00:04:20.600000 | 00:13:47.800000 |
| 2 | 4 | H. PADDON | 00:04:58.100000 | 00:04:29.100000 | 00:04:22.700000 | 00:13:49.900000 |
| 16 | 7 | K. MEEKE | 00:04:59.800000 | 00:04:28.700000 | 00:04:22.100000 | 00:13:50.600000 |
| 9 | 11 | J. HÄNNINEN | 00:04:58.800000 | 00:04:31.100000 | 00:04:21 | 00:13:50.900000 |
| 7 | 14 | M. OSTBERG | 00:04:58.800000 | 00:04:30.400000 | 00:04:23.200000 | 00:13:52.400000 |
SS11 - stage split delta time (seconds) compared to H. PADDON
This chart allows you to compare the on stage performance of each driver, with split times rebased relative to car 4 on stage.
SS12 - stage sector delta time (seconds) compared to H. PADDON stage sector time
This chart allows you to compare the on stage performance of each driver. It displays the "sector time" of each driver (the time between each split point along the stage), rebased relative to car 4.
SS12 - stage sector time (seconds)
| carNo | driverName | sector_1 | sector_2 | sector_3 | sector_4 | sector_5 | time_stageTime | |
|---|---|---|---|---|---|---|---|---|
| start | ||||||||
| 13 | 1 | S. OGIER | 00:05:04 | 00:04:59.200000 | 00:05:49.400000 | 00:03:04.500000 | 00:05:44.400000 | 00:24:41.500000 |
| 12 | 5 | T. NEUVILLE | 00:05:06.100000 | 00:05:01.600000 | 00:05:49.500000 | 00:03:07.600000 | 00:05:43.600000 | 00:24:48.400000 |
| 14 | 6 | D. SORDO | 00:05:05.400000 | 00:05:03.500000 | 00:05:49.900000 | 00:03:07.500000 | 00:05:43.800000 | 00:24:50.100000 |
| 6 | 10 | J. LATVALA | 00:05:06.700000 | 00:05:00.900000 | 00:05:52.300000 | 00:03:08 | 00:05:48.200000 | 00:24:56.100000 |
| 11 | 8 | C. BREEN | 00:05:06 | 00:05:05.400000 | 00:05:49 | 00:03:09.100000 | 00:05:51.500000 | 00:25:01 |
| 8 | 12 | E. LAPPI | 00:05:06.900000 | 00:05:03.700000 | 00:05:54.100000 | 00:03:09.100000 | 00:05:48.500000 | 00:25:02.300000 |
| 7 | 14 | M. OSTBERG | 00:05:06.100000 | 00:05:04.400000 | 00:05:49.900000 | 00:03:10.100000 | 00:05:52.200000 | 00:25:02.700000 |
| 16 | 7 | K. MEEKE | 00:05:09.900000 | 00:05:02 | 00:05:52.300000 | 00:03:08.200000 | 00:05:51.700000 | 00:25:04.100000 |
| 9 | 11 | J. HÄNNINEN | 00:05:06.300000 | 00:05:07.100000 | 00:05:54.500000 | 00:03:07.600000 | 00:05:51.700000 | 00:25:07.200000 |
| 2 | 4 | H. PADDON | 00:05:10.200000 | 00:05:06.200000 | 00:05:53.200000 | 00:03:09.200000 | 00:05:55.400000 | 00:25:14.200000 |
SS12 - stage split delta time (seconds) compared to H. PADDON
This chart allows you to compare the on stage performance of each driver, with split times rebased relative to car 4 on stage.
SS13 - stage sector delta time (seconds) compared to H. PADDON stage sector time
This chart allows you to compare the on stage performance of each driver. It displays the "sector time" of each driver (the time between each split point along the stage), rebased relative to car 4.
SS13 - stage sector time (seconds)
| carNo | driverName | sector_1 | sector_2 | sector_3 | time_stageTime | |
|---|---|---|---|---|---|---|
| start | ||||||
| 12 | 5 | T. NEUVILLE | 00:03:35.100000 | 00:03:47.700000 | 00:03:20.600000 | 00:10:43.400000 |
| 13 | 1 | S. OGIER | 00:03:39.500000 | 00:03:44.800000 | 00:03:20.100000 | 00:10:44.400000 |
| 15 | 2 | O. TANAK | 00:03:41.700000 | 00:03:45.100000 | 00:03:20.100000 | 00:10:46.900000 |
| 6 | 10 | J. LATVALA | 00:03:40.400000 | 00:03:47.900000 | 00:03:18.700000 | 00:10:47 |
| 14 | 6 | D. SORDO | 00:03:40.700000 | 00:03:47.400000 | 00:03:18.900000 | 00:10:47 |
| 11 | 8 | C. BREEN | 00:03:41.200000 | 00:03:46.600000 | 00:03:22 | 00:10:49.800000 |
| 8 | 12 | E. LAPPI | 00:03:41.700000 | 00:03:46.700000 | 00:03:21.700000 | 00:10:50.100000 |
| 7 | 14 | M. OSTBERG | 00:03:41.700000 | 00:03:49.100000 | 00:03:19.400000 | 00:10:50.200000 |
| 16 | 7 | K. MEEKE | 00:03:42.400000 | 00:03:46.900000 | 00:03:21.500000 | 00:10:50.800000 |
| 10 | 3 | E. EVANS | 00:03:41.900000 | 00:03:49.600000 | 00:03:19.600000 | 00:10:51.100000 |
SS13 - stage split delta time (seconds) compared to H. PADDON
This chart allows you to compare the on stage performance of each driver, with split times rebased relative to car 4 on stage.
SS14 - stage sector delta time (seconds) compared to H. PADDON stage sector time
This chart allows you to compare the on stage performance of each driver. It displays the "sector time" of each driver (the time between each split point along the stage), rebased relative to car 4.
SS14 - stage sector time (seconds)
| carNo | driverName | sector_1 | sector_2 | sector_3 | time_stageTime | |
|---|---|---|---|---|---|---|
| start | ||||||
| 12 | 1 | S. OGIER | 00:04:53.900000 | 00:04:21.800000 | 00:04:15.300000 | 00:13:31 |
| 11 | 5 | T. NEUVILLE | 00:04:54.800000 | 00:04:24.700000 | 00:04:16 | 00:13:35.500000 |
| 5 | 10 | J. LATVALA | 00:04:54.100000 | 00:04:25.100000 | 00:04:16.800000 | 00:13:36 |
| 14 | 2 | O. TANAK | 00:04:55.700000 | 00:04:26.800000 | 00:04:14.700000 | 00:13:37.200000 |
| 7 | 12 | E. LAPPI | 00:04:57.100000 | 00:04:24.800000 | 00:04:15.400000 | 00:13:37.300000 |
| 13 | 6 | D. SORDO | 00:04:54.500000 | 00:04:27.700000 | 00:04:16.700000 | 00:13:38.900000 |
| 15 | 7 | K. MEEKE | 00:04:57.100000 | 00:04:26.600000 | 00:04:17.700000 | 00:13:41.400000 |
| 10 | 8 | C. BREEN | 00:04:56 | 00:04:28.500000 | 00:04:19 | 00:13:43.500000 |
| 6 | 14 | M. OSTBERG | 00:04:57.700000 | 00:04:28.600000 | 00:04:19.500000 | 00:13:45.800000 |
| 3 | 9 | S. LEFEBVRE | 00:04:56.500000 | 00:04:30.800000 | 00:04:21.700000 | 00:13:49 |
SS14 - stage split delta time (seconds) compared to H. PADDON
This chart allows you to compare the on stage performance of each driver, with split times rebased relative to car 4 on stage.
SS15 - stage sector delta time (seconds) compared to H. PADDON stage sector time
This chart allows you to compare the on stage performance of each driver. It displays the "sector time" of each driver (the time between each split point along the stage), rebased relative to car 4.
SS15 - stage sector time (seconds)
| carNo | driverName | sector_1 | sector_2 | sector_3 | sector_4 | sector_5 | time_stageTime | |
|---|---|---|---|---|---|---|---|---|
| start | ||||||||
| 11 | 5 | T. NEUVILLE | 00:05:05.700000 | 00:04:57.100000 | 00:05:45.600000 | 00:03:02.800000 | 00:05:42.600000 | 00:24:33.800000 |
| 12 | 1 | S. OGIER | 00:05:03.400000 | 00:04:57.600000 | 00:05:48.500000 | 00:03:06.500000 | 00:05:44 | 00:24:40 |
| 14 | 2 | O. TANAK | 00:05:02.500000 | 00:04:58.700000 | 00:05:47.500000 | 00:03:06.700000 | 00:05:48.700000 | 00:24:44.100000 |
| 5 | 10 | J. LATVALA | 00:05:05.100000 | 00:04:57.700000 | 00:05:50.100000 | 00:03:06 | 00:05:46.200000 | 00:24:45.100000 |
| 15 | 7 | K. MEEKE | 00:05:05.200000 | 00:05:05.200000 | 00:05:48.100000 | 00:03:06.400000 | 00:05:44.500000 | 00:24:49.400000 |
| 13 | 6 | D. SORDO | 00:05:07.400000 | 00:04:58.100000 | 00:05:52.100000 | 00:03:06.400000 | 00:05:51.800000 | 00:24:55.800000 |
| 8 | 11 | J. HÄNNINEN | 00:05:07 | 00:05:00.200000 | 00:05:51.100000 | 00:03:06.300000 | 00:05:51.600000 | 00:24:56.200000 |
| 9 | 3 | E. EVANS | 00:05:04.700000 | 00:05:04.600000 | 00:05:51.900000 | 00:03:07.200000 | 00:05:52.100000 | 00:25:00.500000 |
| 6 | 14 | M. OSTBERG | 00:05:07.800000 | 00:05:02 | 00:05:52.300000 | 00:03:10 | 00:05:50.900000 | 00:25:03 |
| 10 | 8 | C. BREEN | 00:05:09.600000 | 00:05:01.100000 | 00:05:47.800000 | 00:03:22.100000 | 00:05:47.700000 | 00:25:08.300000 |
SS15 - stage split delta time (seconds) compared to H. PADDON
This chart allows you to compare the on stage performance of each driver, with split times rebased relative to car 4 on stage.